Rhapsody in Grey
Using Brain Wave Data to Convert a Seizure to Song
This song generates a musical sequence using EEG brain wave data of an anonymous female pediatric patient with epilepsy. The song examines the periods before, during, and after a seizure. The goal is to give the listener an empathetic and intuitive understanding of the brain's neural activity during a seizure.
Disclaimer
First, I want to state that I have no formal education or training for diagnosing or interpreting a seizure using EEG brain scan data. I have done my own research on this subject to the best of my abilities, but all in all, this is a purely creative endeavor and should in no way be interpreted as scientific research or be used in any context other than in this creative one. For sake of transparency, I have detailed my process for creating this song below and have made all relevant code publicly accessible. Feel free to reach out to me if you notice any glaring inaccuracies.
The Song
Listen to the song by using the player above, or check out the song on Soundcloud if you prefer no visuals or would like to comment on a specific part of the song. Read further down to learn more about how the song was constructed.
Composition & Style
The song composition is entirely algorithmic and is composed of the following building blocks:
-
A Rhapsody: in music, is defined as a one-movement work that is episodic yet integrated, free-flowing in structure, featuring a range of highly contrasted moods, colour and tonality. I thought that this would be an ideal overall metaphor for this song since it covers the three integrated "episodes" of a seizure event:
- Before a seizure (pre-ictal) : During the first 90 seconds of the song, more or less, the patient has normal brain activity. In this stage of the song, the singers' vocals almost synchronize and fall into a clear rhythm.
- During a seizure (ictal) : The following 40 seconds, the patient experiences a seizure. The vocal notes become progressively louder and more scattered as the full seizure event occurs. Hundreds of thousands of neurons fire together at a fast, rhythmic tempo.
- After a seizure (post-ictal) : All the neurons that were firing together have become very tired, and the singers begin to calm. Occasionally, instruments will burst out erratically. The patient is usually confused and disoriented in this stage.
-
Electroencephalography (EEG): is the recording of electrical activity along the scalp. I go into more detail about how I used this data in the Q&A at the bottom of this post. However, as a brief overview, these are the primary brain wave properties I am looking at in the EEG readings and how they affect the music your hear:
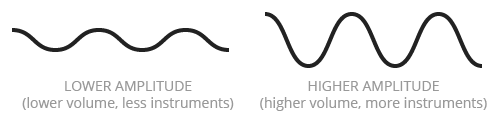
- Amplitude: is essentially how "tall" the waves are. In the song, when brain wave amplitude increases, more singers are added and the instruments become louder.
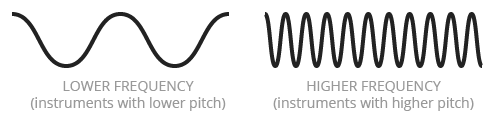
- Frequency: is how many waves are observed over a given time. When the brain wave frequency increases, the string instruments raise their pitch.
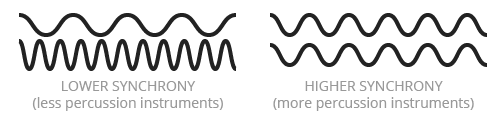
- Synchrony: is the simultaneous appearance of rhythmic or distinct wave patterns over different regions of the head over a given time. When the amplitudes and frequencies are synchronous across the whole brain, percussion instruments are introduced.
- Amplitude: is essentially how "tall" the waves are. In the song, when brain wave amplitude increases, more singers are added and the instruments become louder.
- Phantom Words : when presented with ambiguous sounds, we may hear words and phrases that are not really there. This is part of what Diana Deutsch, a professor of psychology, explores in her Phantom Words and Other Curiosities. Even though my song has to do with someone else's brain activity, I wanted to try to have the sounds in the song engage and perhaps "play" with the listener's brain in an effort to produce a more empathetic experience. So for this song, I implemented my own version Deutsch's Phantom Words using clipped samples of sung words (e.g. , , ).
Sounds Used
I decided to build my sounds around human voice since this is a very human subject. I also wanted the listener to hear something a little familiar to help produce empathy. However, I decided to clip and mix the voice samples up (see "Phantom Words" point above) to encourage an active engagement with the piece. The sources of all samples are listed below:
- 36 vocal samples (e.g. , , ) from Hide And Seek by Imogen Heap, an English singer-songwriter and composer. Given that her song was certified gold by the RIAA and sampled in an internationally popular song , many listeners would be familiar with the vocal sounds. As mentioned above, I hoped that this familiarity could be used to increase the listener's engagement and heighten empathy for the subject.
- 33 double bass samples (e.g. , , ) were taken from the amazing Philharmonia sound sample library, thousands of free, downloadable sound samples specially recorded by Philharmonia Orchestra players. The samples were selected to complement the vocal samples above.
- 4 percussion samples (, , , ) from Reeling The Liars In, A Little God In My Hands, and Still A Child by Swans, an American experimental rock band.
Data Used & Prior Work
The EEG data came from a team of investigators from Children's Hospital Boston and the Massachusetts Institute of Technology who created and contributed a database of 23 multi-day EEG recordings to PhysioNet, a website that offers free access to large collections of recorded physiologic signals and related open-source software.
I also want to acknowledge a couple amazing projects by a number of scientists around the world who are doing some amazing things in this field. First, Stanford scientists Josef Parvizi and Chris Chafe have previously played with music and EEG data and are building powerful biofeedback tools for identifying brain patterns associated with seizures. Also, Dr Alistair McEwan along with a team of researchers at the University of Sydney are working on a simple method of converting the brain wave signals of people living with epilepsy into sound. These projects have been both inspirational and informative to my small and modest project.
Tools & Process
This song was algorithmically generated in that I wrote a computer program that took data and music samples as input and generated the song as output. I did not manually compose any part of this song.
For those interested in replicating, adapting, or extending my process, all of the code and sound files is open source and can be found here. It also contains a comprehensive README to guide you through the setup and configuration. The following is a brief outline of my process:
- Based on the project's objective, I decided upon a stylistic and compositional approach.
- I then extracted individual instrument and vocal samples from relevant sources.
-
Using Python, a widely used programming language, I:
- Extracted a 3:30-minute excerpt from the raw EEG data in the previous section which contained a 40 second seizure event.
- Sliced the data up into small and equal time intervals
- Calculated the average amplitude, frequency, and synchrony of each time interval across all channels.
- Assigned instrument and voice samples to each time interval based on the amplitude, frequency, and synchrony values.
- Generated a sequence of sounds that correlate to the calculations made in previous 3 steps.
- The sequence of sounds from the previous step was fed into ChucK, a programming language for real-time sound synthesis and music creation. I used ChucK because it is really good at generating strongly-timed sequences. The output would then be an audio file that I could listen to.
- I then repeated the previous steps numerous times, tweaking the sounds and the algorithms until I was satisfied with the result
- I used Processing, a programming language with a visual focus, to generate the visualization using the data above.
If you happen to use my code and create something new, please shoot me an email at hello@brianfoo.com. I'd love to see and share your work!
Q&A
In this section, I will go more deeply into my process as well as document answers to select questions I've received after the initial post.
What do the numbers/labels mean?
This EEG recording utilizes the 10-20 System, an internationally recognized method to describe and apply the location of scalp electrodes in the context of an EEG test. The electrode sites are defined as follows:
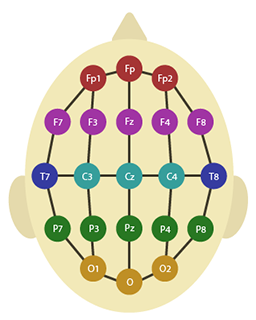 Each electrode has a letter to identify the lobe and a number to identify the hemisphere location. The letters F, T, C, P and O stand for frontal, temporal, central, parietal, and occipital lobes, respectively. Fp stands for frontal polar.
- A "z" (zero) refers to an electrode placed on the midline. Even numbers (2,4,6,8) refer to electrode positions on the right hemisphere, whereas odd numbers (1,3,5,7) refer to those on the left hemisphere.
- Consecutive pairs of electrodes are linked by connecting the electrode input 2 of one channel to input 1 of the subsequent channel, so that adjacent channels have one electrode in common.
How and why did you map certain EEG properties to sound?
The strategy for mapping EEG data to sound follow three main rules:
- An increase in brain wave amplitude will result in more singers singing and louder instruments playing. This was a very natural translation since the concept of amplitude exists in both EEG recordings and music production.
- An increase in brain wave frequency will result in the string instruments playing notes at a higher pitch. Higher wave frequencies in the context of an EEG reading generally implies a more alert and active state, as opposed to lower frequencies which may imply a sleeping or resting state. Like amplitude, frequency also has a natural translation into music.
- An increase in brain wave synchrony will result in the appearance of percussion instruments. In EEG, synchrony refers to the simultaneous appearance of rhythmic or distinct patterns over different regions of the head. Since a drummer aids in synchronizing multiple musicians, I thought percussion would be a good analogy for brain wave synchrony.
What are the notable sections of the EEG recording?
I have identified 5 areas of interest within this EEG recording. To illustrate what is happening in each area, I created a graph that shows the average values of amplitude (blue), frequency (red), and synchrony (green) across all channels over time.
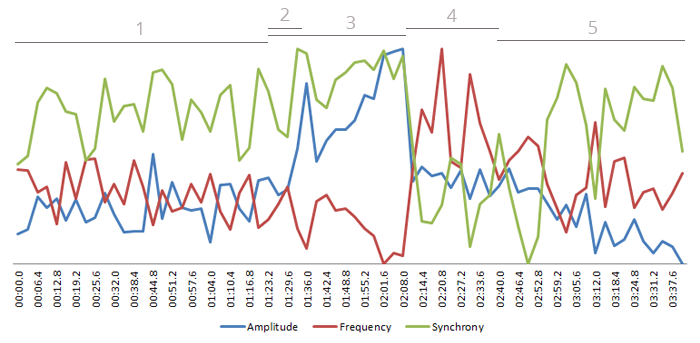
- Normal neural activity (0:00 - 1:32) : moderate amplitude, frequency, and synchrony. The resulting song is calm and rhythmic.
- Seizure begins, increased neural activity (1:32 - 1:38) : sharp increase in amplitude and synchrony, sharp decrease in frequency. In the song, more voices appear and percussion is introduced.
- Seizure event, high and rhythmic neural activity (1:32 - 2:12) : increasing amplitude, decreasing frequency, and high synchrony. The song becomes louder, voices are scattered, and percussion is loud and rhythmic.
- Seizure stops, erratic neural activity (2:12 - 2:36) : sharp decrease in amplitude and synchrony, bands of high frequency erratically appear. In the song, percussion stops and individual string instruments erratically burst out in high-pitch notes.
- Low neural activity (2:36 - 3:24) : low amplitude, normal frequency and synchrony. In the song, singers become sparse and the intervals between singing are longer.
How did you sample the EEG reading?
For the purpose of this song, I selected a small 3:30-minute excerpt of a 46-hour monitoring session of an anonymous 11-year-old female patient with epilepsy. After identifying a 40-second seizure in the EEG data, I added 90 seconds before and after the seizure event. The song's time scale matches the EEG data's time scale, so the song's length is 3:30 as well.
Why Seizures?
I have always had a personal fascination with what goes on in the brain, our most complex and distinguishing organ. Epilespy affects about 1% of people worldwide (65 million), and like many brain-related disorders, the causes are unknown in many cases. There has already been some amazing work around using sound to help individuals with epilepsy and their caretakers. In terms of creating a song, I was interested in using music to produce empathy between two people, where the listener can "experience" what might be going on in someone else's brain. In terms of song composition, normal brain activity juxtaposed with an event like a seizure can produce a highly contrasting and dynamic song.
Questions & Feedback
I'd love to hear from you. I'm sure I've also made some erroneous statements somewhere, so please correct me. You can use the widget below or email me at hello@brianfoo.com.
Data-Driven DJ is a series of music experiments that combine data, algorithms, and borrowed sounds.
My goal is to explore new experiences around data consumption beyond the written and visual forms by taking advantage of music's temporal nature and capacity to alter one's mood. Topics will range from social and cultural to health and environmental.
Each song will be made out in the open: the creative process will be documented and published online, and all custom software written will be open-source. Stealing, extending, and remixing are inevitable, welcome, and encouraged. Check out the FAQs for more information.
About me
 My name is Brian Foo and I am a programmer and visual artist living and working in New York City. Learn more about what I do on my personal website. You can also follow my work on Twitter, Facebook, Soundcloud, or Vimeo.