Too Blue
Mapping Coastal Louisiana's Land Loss with Music
This song was generated by tracking the land loss in Coastal Louisiana over 78 years due to man-made levees, drilling and dredging for oil and gas, and climate change. The song's instruments stretch and diminish over time as more land becomes displaced with water. The data has been provided by the United States Geological Survey (USGS). The song uses sound samples from the Rebirth Brass Band, a New Orleans brass band.
The Song
Listen to the song by using the player above, or check out the song on Soundcloud if you prefer no visuals or would like to comment on a specific part of the song. Read further down to learn more about how the song was constructed.
Background
Coastal Louisiana wetlands make up the seventh largest delta on Earth and contain 40 to 45 percent of the wetlands found in the lower United States. Coastal Louisiana also supports the largest commercial fishery in the lower 48 States and is home to half of the country's oil refineries that serve 90 percent of the nation's offshore energy production.
From 1932 to 2010, coastal Louisiana has undergone a net loss in land area of about 1,900 square miles, making it one of the fastest-disappearing areas in the world. This net change in land area amounts to a decrease of about 25 percent of the 1932 land area. If this loss were to occur at a constant rate, it would equate to Louisiana losing an area the size of one football field per hour.

Source: NASA/USGS Landsat
This loss of land has largely resulted from human mismanagement of the coast. Artificial levees block spring flood water that would bring fresh water and sediment to marshes. Swamps have been extensively logged, leaving canals and ditches that allow saline water to move inland. Canals dug for the oil and gas industry also allow storms to move sea water inland, where it damages swamps and marshes. Rising sea waters caused by climate change have also exacerbated the problem.
Without human damage reduction and active restoration efforts, coastal communities will continue to disappear and leave the region. Since the coastal wetlands support an economically important coastal fishery, the loss of wetlands is adversely affecting this industry.
The Data & Prior Work
This piece was largely inspired by Losing Ground, a comprehensive interactive web project and map of land loss in coastal Louisiana created by ProPublica and The Lens. The satellite imagery in the song's visualization was also provided by NASA/USGS Landsat via Losing Ground.
The data for this piece was taken from a 2011 report by the U.S. Geological Survey, Land Area Change in Coastal Louisiana from 1932 to 2010. The report combines 17 datasets that include historical survey data from 1932, aerial data from 1956, and satellite data from the 1970s to 2010.
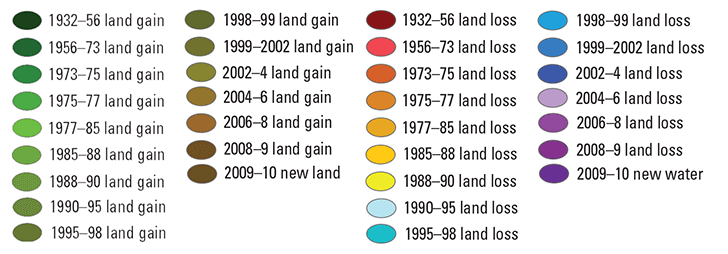
For the purposes of this song and visualization, I focused on the southeast tip of the Louisiana coast (includes areas Leeville, Grand Isle, Buras, Venice, and West Bay where the Mississippi River empties into the Gulf of Mexico) which shows some of the more dramatic losses of land of the period of time covered by the USGS report. The following image is a visualization of the land area change datasets, where each color represents loss or gain in each of the 17 datasets.

Source: Land Area Change in Coastal Louisiana from 1932 to 2010, USGS
Generally speaking, shades of green indicates land gain. All other colors (red, orange, yellow, blue, violet) indicate land loss at different time periods. Black or gray indicate persistent land or water (no change). Here is another way to look at this data with a bar chart:

Source: Land Area Change in Coastal Louisiana from 1932 to 2010, USGS
You can download the full report and view the data to learn more.
Composition
The song composition is entirely algorithmic and is composed of the following building blocks:
- The USGS provides 17 datasets (see above) spanning from 1932 to 2010 that summarizes land area changes in coastal Louisiana. Each dataset provides a timespan and the change in land area during that time. Each dataset/timespan represents about an 8-second segment of the song.
- The song exclusively samples the vocals and instrumentation by the Rebirth Brass Band, a New Orleans brass band. See the section on sounds for more information.
- As land is displaced by water, the instruments and vocals in the song become stretched and diminish. I wanted to make the music sound like it was slowly being submerged in water.
Style & Sounds Used
The song exclusively samples the 25th Anniversary performance by the Rebirth Brass Band, a New Orleans brass band. I thought the band and genre would be appropriate for this song because the tradition of brass bands have existed in New Orleans, Louisiana since the late 19th century. The Grammy-winning Rebirth Brass Band was founded in 1983 in New Orleans' Tremé neighborhood, and known to be one of the first bands to combine traditional New Orleans brass band music with funk, jazz, soul and hip hop. I thought that the energy and excitement of the band's music would provide a good contrast of sound as the instruments and vocals deteriorate throughout the song. There are 18 samples that I use in total, each of which are under one second long. Here is a list of samples used in this song:
- 5 Brass (, , , , ), 4 vocal (, , , ), and 2 percussion (, ) samples from Here to Stay (excerpts: ).
- 3 Tuba (, , ) and 1 Vocal () samples from Right Foot .
- 3 Vocal samples (e.g. , , ) from Feel Like Funkin It Up .
I use the Paulstretch algorithm to stretch the samples between 2 and 8 times longer than their original length (e.g. 1x , 2x , 3x , 4x , 8x ). I prefer this method of stretching sound clips because it uses "spectral smoothing", which allows for extreme sound elongation without degrading the quality/texture of the original sound.
Tools & Process
This song was algorithmically generated in that I wrote a computer program that took data and music samples as input and generated the song as output. I did not manually compose any part of this song.
For those interested in replicating, adapting, or extending my process, all of the code and sound files is open source and can be found here. It also contains a comprehensive README to guide you through the setup and configuration. The following is a brief outline of my process:
- Based on the project's objective, I decided upon a stylistic and compositional approach.
- I identified and downloaded the relevant data from the USGS.
- I extracted individual instrument samples from relevant sources.
- I generated stretched samples using the Paulstretch algorithm written in Python.
- Using Processing, I:
- Calculated the loss and gain of land from each of the 17 datasets/timespans provided by the USGS.
- Determined where the loss/gain of land was located in the map for each timespan.
-
Using Python, I:
- Assigned instruments to each timespan based on the the calculations from previous step's output.
- Generated a sequence of sounds based on the instrument assignments of the previous step.
- The sequence of sounds from the previous step was fed into ChucK, a programming language for real-time sound synthesis and music creation. I used ChucK because it is really good at generating strongly-timed sequences. The output would then be an audio file that I could listen to.
- I then repeated the previous steps numerous times, tweaking the sounds and the algorithms until I was satisfied with the result
- I used Processing to generate the visualization using the data above.
If you happen to use my code and create something new, please shoot me an email at hello@brianfoo.com. I'd love to see and share your work!
Questions & Feedback
I'd love to hear from you. I'm sure I've also made some erroneous statements somewhere, so please correct me. You can use the widget below or email me at hello@brianfoo.com.
Data-Driven DJ is a series of music experiments that combine data, algorithms, and borrowed sounds.
My goal is to explore new experiences around data consumption beyond the written and visual forms by taking advantage of music's temporal nature and capacity to alter one's mood. Topics will range from social and cultural to health and environmental.
Each song will be made out in the open: the creative process will be documented and published online, and all custom software written will be open-source. Stealing, extending, and remixing are inevitable, welcome, and encouraged. Check out the FAQs for more information.
About me
 My name is Brian Foo and I am a programmer and visual artist living and working in New York City. Learn more about what I do on my personal website. You can also follow my work on Twitter, Facebook, Soundcloud, or Vimeo.